

-2.jpeg?width=2000&name=AdobeStock_785443953%20(1)-2.jpeg)
CONTINUOUS SIDE-BY-SIDE ANALYSIS: A PRACTICAL APPROACH TO QUANTIFYING PERFORMANCE GAIN DUE TO WIND TURBINE OPTIMIZATION
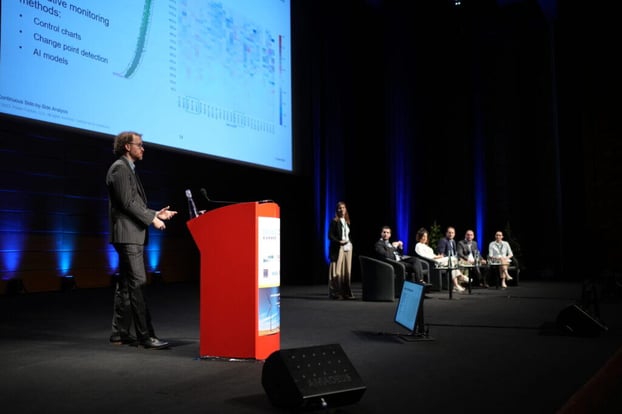
Anthony Crockford, Technical Director, Advanced Analytics at Power Factors, shares insights from WindEurope Technology Workshop in Lyon, France, on June 2, 2023.

Anthony Crockford, Technical Director, Advanced Analytics at Power Factors, shares insights from WindEurope Technology Workshop in Lyon, France, on June 2, 2023.
INTRODUCTION
At the beginning of this month, I had the honor of speaking at the WindEurope Technology Workshop on using the continuous Side-by-Side method to quantify performance gain for wind turbines.
This is a follow-up to a presentation I gave seven years ago in the same forum, which covered the limitations of calculating performance gain purely through nacelle power curves. Since then, our methods have evolved thanks to assignments and data experiments on the 100+ GW of wind farms monitored by Power Factors.
QUANTIFYING PERFORMANCE GAIN
The standard wind turbine parameters, because they are optimized for specific model conditions or at a specific test site, will not be optimal for every site. To address this, it’s possible to experiment with controller parameters and optimize each turbine individually.
Many OEMs and third parties offer versions of this service, and it’s proven successful. For example, DEIF has presented the multiple methods which have proven basis through theoretical or practical experiments. But how do you measure the success of these kinds of improvement initiatives?

The important point for this article is that we’re looking at relatively small gains— typically around 0.5-2%. But even a modest performance improvement can boost profits if the improvement costs are reasonable. Many providers charge for these services as a function of the observed performance gain. So, we need to validate first that there was a gain and then we need to quantify how much gain as accurately as possible.
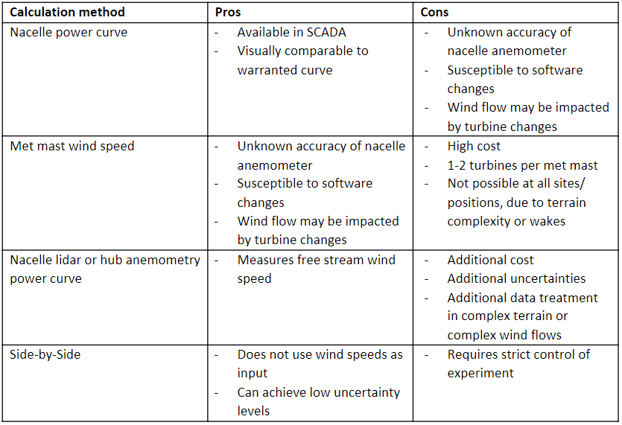
When comparing performance before and after a modification, we want to control for the wind resource. There are several methods which do that via wind measurements, including nacelle anemometry, met mast or nacelle lidar. But these measurements have relatively high uncertainty, so the best way to lower uncertainty is to exclude wind measurements altogether. See Table 1 below for the pros and cons of various performance gain evaluation methods.
SIDE-BY-SIDE METHOD: TURBINE PAIR
This brings us to the Side-by-Side method, which focuses on turbine power output. The method directly compares the power output of two proximate wind turbines: a control and a modified turbine. The relative difference in power output between wind turbines is established over a test period, and compared to a reference period where both turbines were operated in identical settings.
In the above plot, the blue data represents the difference in power output during the reference period, while the red data represents the same during the test period. The black line is the bin-wise mean of the reference data, and the green line is during the test period.
In this example, where the green line is higher than the black line, we have found a quantifiable performance gain. Despite extensive filtering for turbine status, wakes, and invalid data, the data clouds are still quite variable, so it is key to apply statistical tests to ensure that the difference between the red and blue datasets is statistically significant.
We can also quantify the uncertainty, beginning with the statistical scatter in the measurements and the instrument biases which are assumed to cancel out since the same equipment is used in both periods and the relative difference is being calculated. Those two components account for about 0.5% of uncertainty, but there are other uncertainties to be assessed. We accomplish this by sensitivity tests.
First, there is the representativity of the reference and test periods. With shorter campaigns, you can introduce seasonal biases, and event with a 12-month campaign before/after, you may introduce some biases depending on the specific wind conditions or filtering. Finally, there are the sensitivities in the model parameters, like bin sizes, filters, confidence levels, etc.
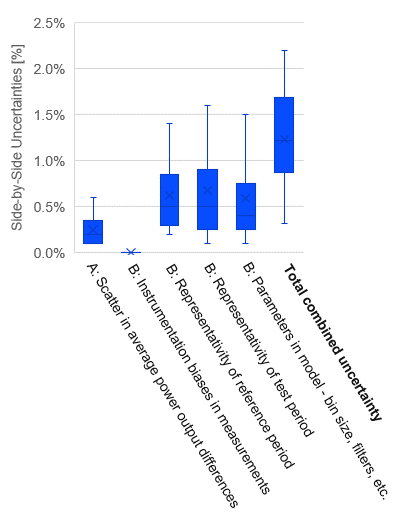
The combined uncertainty is typically around 1%, which is lower than wind-speed-based methods, but still within the same order of magnitude of the observed gains.
There are some known limitations to the Side-by-Side method.
- Extensive filtering is required to ensure both turbines experience similar conditions, which can lead to a very limited amount of comparison data. Also, it means that results will be limited to the filtered conditions. The calculated gain may not be representative in wakes, curtailment, or other excluded conditions.
- Wake filtering relies on accurate yaw azimuth, and those sensors have frequent quality issues.
- This is an involved calculation per single modified turbine, and the analysis needs to be repeated over a representative percentage of turbines in wind farm.
- Finally, the method requires strict experimental conditions over a period of 2+ years. Upgrades or other software changes should not be applied to control turbines, and upgrades need to be properly applied to modified turbines on known dates.
SIDE-BY-SIDE METHOD: WIND FARM
Which brings us to the first variant: the wind farm Side-by-Side. Instead of looking at a turbine pair, we split the wind farm into two groups a control set (e.g., 20%) and a modified set, and we compare the power difference between the groups.
The big advantage is that we get to do a single analysis for all wind turbines in a wind farm at once.
The other big advantage here is we don’t have to do as much wake filtering, and we can evaluate performance gain across more of the typical operating conditions.
This approach does impact uncertainty. There can be an increase in the statistical scatter, but that may be mitigated by less sensitivity to the periods and model parameters. The combined uncertainty could remain in the same region of 1-1.5%.
CONTINUOUS SIDE-BY-SIDE
But there are still questions remaining which are not addressed by the above concepts:
- Is this result representative of the future?
- Will the results hold true for future wind conditions, or with future changes to operations?
- What if some Vortex Generators come unglued?
- What if blade erosion would require new pitch optimization?
- What if future grid curtailment means more focus on gains at low wind speeds?
- What if a new wind farm is constructed nearby?
- Is there further potential for optimisation?
- Should the settings change over seasons?
- Or according to wind direction or meteorological conditions?
- Will a subsequent improvement package provide additional benefit or negate some of past gains?
It’s not possible to rerun a two-year Side-by-Side campaign to help answer these questions. But if you’ve established a solid 12-month baseline, you can maintain a continuous Side-by-Side analysis to monitor the performance gain over the rest of the wind farm lifetime.
A portion of turbines (~20%) are designated as control turbines. And the performance gain of the remaining turbines can be continuously monitored. Like a standard Side-by-Side, this quantifies the initial improvement. But it also monitors whether that gain is maintained through time. It may help to identify whether subsequent changes negate some of the improvement, or whether further optimisation is possible.
To close with an example of what a Continuous Side-by-Side looks like, here is a heatmap looking at the power differential per bin every month over the last couple of years since this power improvement package was implemented. Anywhere that the heatmap is red, there is a performance gain for the modified turbines versus the control turbines, whereas anywhere blue is a performance decrease.
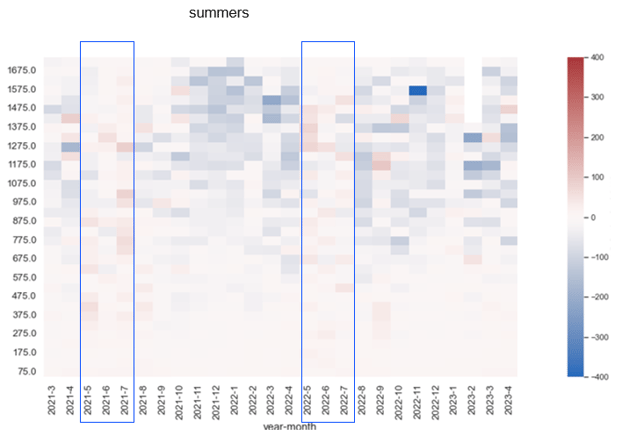
In this example, we can see this improvement package is working well during the summers, but there is a performance decrease at some higher power bins in winter months. So, there’s more room to tweak the settings in the winter in the winter months.
CONCLUSIONS
- By primarily considering power output, the Side-by-Side Analysis can calculate performance gain within reasonable uncertainty levels.
- To achieve the lowest uncertainty levels, it is necessary to properly select turbine pairs, filter extensively to ensure similar conditions, and apply statistical tests.
- An alternative approach comparing turbine sets allows the calculations to include wider range of operating conditions and cover the majority of turbines in single analysis.
- Maintaining a Continuous Side-by-Side experiment monitors that gains are maintained and reveals potential for additional optimization.
Follow Anthony Crockford, Technical Director, Advanced Analytics and Power Factors on LinkedIn!
End-to-end solutions across the entire renewable asset lifecycle


Optimize assets, maximize revenue, and grow your portfolio with Unity
