The 10 Things You Need to Know to De-risk Solar O&M – #4: Know Your Break-Even Truck Roll Cost

Stay in touch
Subscribe to our newsletter for expert insights, company updates, and the latest in renewable energy management solutions.
THE COST OF NOT KNOWING*
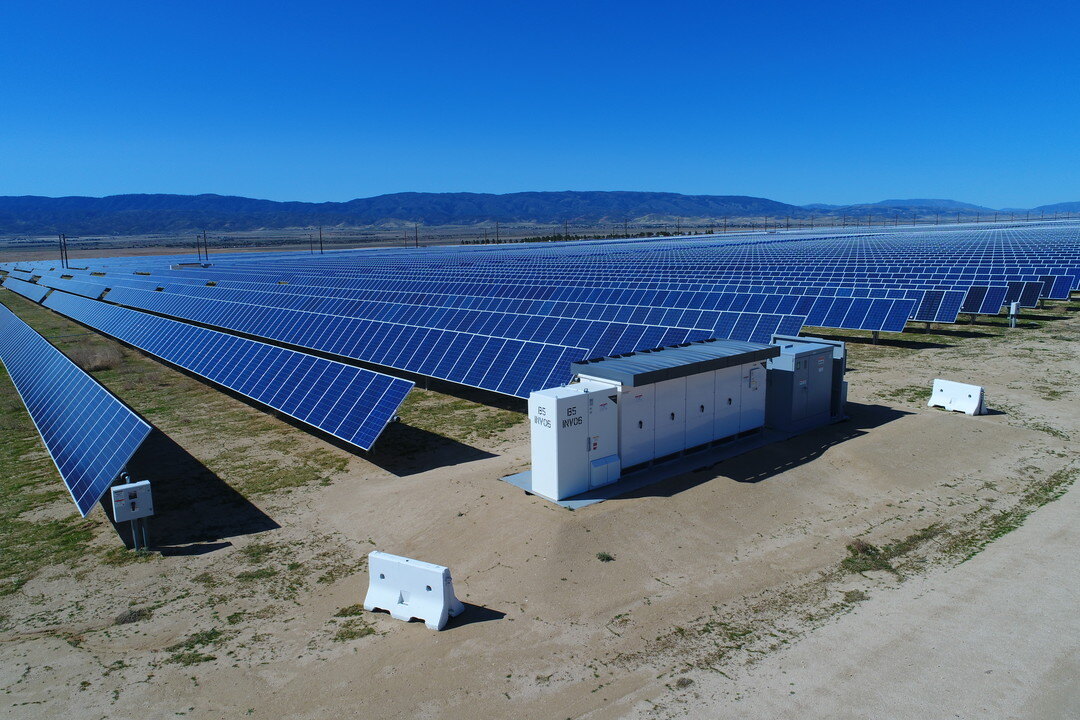
Most traditional power projects have dedicated operations and maintenance personnel who work at the site. Even wind power plants have regional personnel who can quickly mobilize to perform corrective maintenance on the plant equipment. The typical solar power project, however, does not have dedicated local O&M staff supporting site maintenance.
In addition, unlike traditional and wind power projects where there only a few to dozens of electrical generators, a solar power project may have thousands or even millions of electrical generators. As a result, a typical solar performance issue, like a stuck tracker or a blown combiner box fuse may only affect a few kilowatts and have a small economic impact.
Is it financially viable to roll a truck every time a string open-circuits at my plant? Given the loss of 3-5 kilowatts of production versus the cost of the truck roll, probably not! Proper planning and scheduling of on-site corrective maintenance tasks based on economic priority becomes all important for solar power projects.
HOW TO USE BREAK-EVEN TRUCK ROLL COSTS
Before we calculate our break-even truck roll costs it is important to understand how this information will be used in dispatch decision-making once it is available. The primary purpose of this metric is to equip Schedulers to economically stack field service maintenance work. Unless you have free and unlimited field service personnel at your disposal, you will want to rank your field service maintenance by economic priority. I would suggest that field service dispatch always starts with safety issues, first, and is then prioritized based on opportunity cost.
By “opportunity cost” I mean the cost that you would forego by not immediately performing the work. If the field service work is to manually reset the plant breaker, then your opportunity cost is the lost revenue that is accruing because the plant is off-line. If the truck roll is to fix a tracker that is not tracking, your opportunity cost is some fractional underperformance of that array in lost dollars per day.
For example, if a tracker supports 250 kW of array power and stops tracking, at a $0.10/kWh PPA price, your opportunity cost for that event is about $28/day. If a truck roll costs you $400 per trip, your break-even dispatch period for that event is about 14 days (400/28). If all your field service team is fully utilized on higher opportunity cost work orders, you should defer the truck roll until you will already be on site in the next few weeks doing planned maintenance activities.
When comparing break-even truck roll costs with opportunity costs you will want to compare the rate of the lost opportunity not just the accumulated lost opportunity.
In other words, we don’t want to make field service dispatch decisions after we have already lost more revenue than our truck roll costs. We want to rank work orders priority based on what we will lose if these losses continue over time. This is why our asset performance management software displays the rate of all fleet losses with a trend line where the higher cost losses have a steeper slope than the lower cost losses (see Figure 1). Schedulers can quickly compare this data with truck roll costs to make intelligent dispatch decisions.

HOW TO CALCULATE BREAK-EVEN TRUCK ROLL COSTS
To calculate break-even truck roll costs for your organization, you will want to factor at least the following items into your analysis:
- Average distance to project location
- Average number of technicians required
- Fully loaded base labor rate – should include benefits, cost to train and fully equip with tools and PPE
- Technician utilization rate – billable hours divided by potential work hours
- Amortized vehicle expense rate – lease, fuel, insurance and maintenance
- Other costs – if air travel and lodging is required, include those costs per trip if they are not fully reimbursable
Ultimately, we want to know the average cost per truck roll in dollars per site visit of non-reimbursable costs. You may want to further categorize truck roll costs by distance:
- Local (less than 20 miles or 1 hour by vehicle)
- Regional (more than 1 hour, by vehicle)
- Overnight (requires non-reimbursable air fare, lodging or extended vehicle travel)
Let’s assume you generated the following truck roll costs for your organization for one of your service regions:
- Local – $125
- Regional – $400
- Overnight – $1500
Therefore, unless you have service level agreement penalties or some other disincentive, you would not perform an overnight corrective maintenance task like resetting an inverter until your break-even accumulated lost revenue was greater than $1500.
For example, if a remote (overnight) plant lost a 500 kW inverter for a project with a PPA price of $0.10/kWh, you would be losing about $180 per day. Therefore, your recovery period for a $1500 truck roll would be about 8 days. If your field service team is fully loaded doing cost effective maintenance elsewhere, you are better off deferring the maintenance for a week or so until you can group it with other work in the area.
SUMMARY
Scheduling corrective maintenance for the solar asset class needs to be evaluated using a different paradigm than traditional and wind power assets. Having equipment event data sorted by opportunity costs to compare with truck roll costs is essential for running an economic fleet. Power Factors’ performance management software platform provides this kind of real-time visibility into operational performance and equipment maintenance translated into dollars, so the right economic decision can be made.
Next week we will address the topic of having a well-defined service delivery model. As always, your feedback and insights on these important topics are appreciated.
*Note that this paper is written from the perspective of the plant owner. If the operator does not have aligned incentives with the owner, opportunity costs may be different and mis-aligned with the owner’s.
Steve Hanawalt is Executive Vice President and Co-Founder of Power Factors LLC
