


[ARTICLE 2] THE FIRST STEP IS THE HARDEST: DESCRIPTIVE ANALYTICS FOR PV PLANTS – PART I
Descriptive analytics is the first step in converting data to information. But this foundational step remains a huge challenge in the solar industry.

By Steve Voss, VP of Advanced Analytics at Power Factors
This is the second article in the series What You Need to Know About Solar Analytics. In this series, Steve Voss, VP of Advanced Analytics at Power Factors, talks through what you need to know about solar analytics to get the most value out your data. Don’t miss an article: Follow Power Factors on LinkedIn.
In the first article of this series, we talked about using the Garner analytics ascendancy model as a framework to explore how analytics can help reduce PV maintenance costs and improve plant performance.

According to the Gartner analytics ascendancy model, descriptive analytics is the practice of determining what happened. Typically, descriptive analytics manifests in the PV industry as reporting: an account of what happened in the past day, week, month, etc.
It’s easy to conflate “basic” with “least valuable.” And, when looking at the Garner analytics ascendancy model, it might be easy to dismiss descriptive analytics as the most basic — and least valuable — type of data analytics. But there is much more to descriptive analytics than basic operational reporting.
SO… WHAT HAPPENED?
Descriptive analytics is the first step in converting data to information, covering everything from data management to cleaning and contextualization. This fundamental step remains a huge challenge in the PV industry for many reasons, including:
- High volumes of data
- The distributed nature of PV plants (which contributes to low data quality)
- Continuous downward pressure on cost and pricing (e.g.: trying to cut costs by not installing — or not calibrating — sensors)
- Significant discrepancies in the data available for different sites and devices (including metadata, meteorological data, performance data, supplemental monitoring, and field service records)
To get the information we need from the data we have means we need to first address these challenges. This requires three foundational elements:
- Robust data management
- Auditability
- Flexibility and functionality
We’ll define and discuss each of these three foundational elements below.
DATA TO INSIGHTS: THREE FOUNDATIONAL ELEMENTS
FOUNDATIONAL ELEMENT #1: ROBUST DATA MANAGEMENT
A lot goes into robust data management, and it all starts with data quality. Quality data is data that is complete, accurate, and repeatable. At Power Factors, we take data quality a step further, accounting for something we call “data capability.” Data capability is a broader concept that assesses not only the quality of the available data, but if the data we have available can deliver the information we need.
Consider the table below. In the “Low Capability” column, the data we have may be complete, accurate, and repeatable — but even good data from the “Low Capability” column wouldn’t tell us enough to provide meaningful PV analytics.
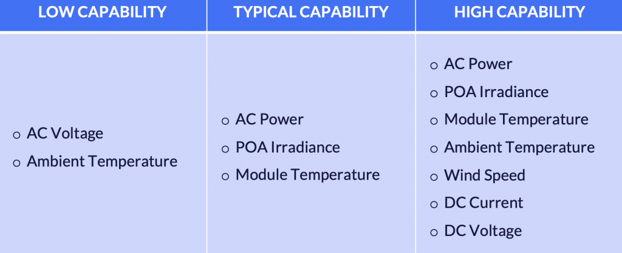
We built the Data Capability framework into the Drive platform to address this problem. The framework incorporates over 250 unique metrics and tests to help you understand the information you can expect to get from the data you have.
Data Capability itself is a form of descriptive analytics. It does the essential work of compiling and communicating the data limitations associated with a given site or device and telling you which issues need to be addressed to enable higher orders of functionality and confidence in downstream analysis and results.
Data Capability results also enable the Drive platform to adapt to the data available, providing you with the best information possible.
FOUNDATIONAL ELEMENT #2: AUDITABILITY
Robust data management — including determining data capability — kicks off the process, but it’s essential that subsequent steps continue to be auditable. Auditability is the principle of showing your work.
While users of a system ultimately want “the answer,” it’s important to show how you arrived at the answer for two key reasons:
- Trust-building: Showing your work in a clear, concise, and accessible way is the best way to build trust in the results among your team.
- Audit trail: When something goes wrong, the audit trail is critical to a diagnostic analysis of what went wrong and why.
Power Factors’ validation, estimation and editing (VEE) process is a simple example of auditability. VEE ensures that key time-series data — such as plane of array (POA) irradiance and energy accumulators — are complete, continuous, and validated. In practice, this means that each interval is evaluated to detect missing or invalid data. Missing or invalidated intervals are then replaced by the best available backup data source.
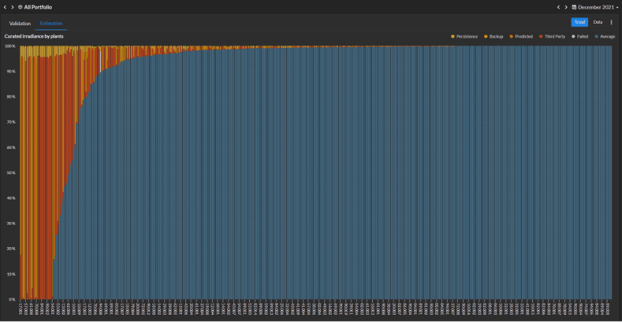
To ensure auditability, the results of both the validation and estimation steps are recorded using time-series signals that indicate the reason the data was invalid as well as what data source replaced it. This information is then available for auditing, reporting, or troubleshooting. For example, a quick glance at the Estimation dashboard (above) allows uses to identify plants where estimation is being heavily deployed along with the method of estimation used.
FOUNDATIONAL ELEMENT #3: FLEXIBILITY AND FUNCTIONALITY
The third foundational element required to address the challenges of converting PV plant data to useful information is a system that finds an optimal balance between flexibility and functionality. Flexibility is “the ability to be easily modified” while functionality can be defined as “the quality of being suited to serve a purpose well.” In other words, functionality is the quality of not needing to be modified.
An infinitely flexible system can do anything the user imagines. But this flexibility comes with drawbacks from high set-up costs to ongoing maintenance costs to a loss of standardization.
An infinitely functional system would be an Expert System: one that already knows exactly how an expert user would handle the situation. This is the direction we need to go as an industry. However, there are limitations. Aninfinitely functional system needs to anticipate all the scenarios and corner cases it may encounter and be certain all expert users would react in the same way to a given scenario (or be aware of all the details and nuances that would prompt an expert user to react in a different way).
Neither the infinitely flexible nor the infinitely functional system scenarios are practical — there’s often a tradeoff between the flexibility of the system and the depth of functionality it can deliver.
Let’s explore some concrete examples of how the flexibility/functionality topic applies to descriptive analytics for PV plants:
- Sun Position (functionality required): This is an important concept for PV analytics and a good example of where we want to strive for infinite functionality. All the system needs to be told is the location of the site and it should do the rest.
- Expected Production (functionality and flexibility required): Expected Production is the power output that is anticipated from a given site or device based on known or estimated operating conditions. When it comes to Expected Production, there are use cases that require functionality and others that demand flexibility.
- Functionality required: Downstream use cases such as underperformance anomaly detection dictate a certain degree of standardization.
- Functionality required Some users and use cases prioritize simply obtaining the best quantitative estimate for a given site and its data capability.
- Flexibility required: Some users and use cases require a specific expected production calculation methodology — the ability to select and change which formula is used and what inputs are required.
- Functionality and flexibility required: Many use cases require that different loss factors (controllable vs. uncontrollable) be included or excluded based on the scenario.
- Contractual Availability (flexibility required): On the opposite end of the spectrum from sun position is contractual availability. Many factors can influence the definition of contractual availability and, aside from a few basic structural elements, any attempts to standardize are likely to limit applicability and usefulness.
CONCLUSION
When you’re trying to turn data into information you can use, descriptive analytics is the first step. But, due to challenges unique to the PV industry, three foundational elements determine success:
- Robust data management includes understanding how much your data is capable of telling you
- Auditability: Simply having “the answer” isn’t good enough — you also need to be able to see how the system arrived at this answer
- Systems with the right mix of flexibility and functionality depending on the use case and situation
Now that we’ve covered the foundational elements needed to start the journey toward valuable PV analytics, we’re ready to dig into real-world examples of the value of descriptive analytics — from reliable reporting to automation to benchmarking.
Don’t miss the next article in the What You Need to Know About Solar Analytics series: “The First Step is the Hardest: Descriptive Analytics for PV Plants (Part 2)” — follow Power Factors on LinkedIn.
Did you find this article helpful? Sign up for our newsletter for the latest in digital asset management, performance optimization and more!
Steve Voss joined Power Factors in 2016 and has over 20 years of solar industry experience. Prior to joining Power Factors, Steve spent a year working with Panasonic Energy Services and nine years with SunEdison as Director of Advanced Engineering. Steve holds an MBA from the University of Wisconsin, Madison, and a Master’s of Materials Science and Engineering from Stanford University. He did his undergraduate work at the University of Colorado, Boulder. Connect with Steve on LinkedIn.
End-to-end solutions across the entire renewable asset lifecycle
![[Article 5] Predictive Failure Analytics — What Will (Probably) Happen](https://www.powerfactors.com/hubfs/aerial-top-view-of-a-solar-panels-power-plant-2021-08-28-11-59-44-utc.jpeg)
![[Article 3] The First Step is the Hardest: Descriptive Analytics for PV Plants – Part II](https://www.powerfactors.com/hubfs/aerial-top-view-of-a-solar-panels-power-plant-LG9ZG4C.jpg)
![[Article 4] Diagnostic Analytics for PV Plants — Why Did It Happen?](https://www.powerfactors.com/hubfs/engineer-electric-woman-checking-and-maintenance-o-2022-02-01-22-37-40-utc-1.jpeg)
Optimize assets, maximize revenue, and grow your portfolio with Unity
