
[ARTICLE 5] PREDICTIVE FAILURE ANALYTICS — WHAT WILL (PROBABLY) HAPPEN
A clear-eyed assessment of both the potential benefits — and limitations — of predictive analytics as applied to solar.
By Steve Voss, VP of Advanced Analytics at Power Factors
This is the fifth article in the series What You Need to Know About Solar Analytics. In this series, Steve Voss, VP of Advanced Analytics at Power Factors, talks through what you need to know about solar analytics to get the most value out your data. Don’t miss an article: Follow Power Factors on LinkedIn.
Predictive analytics tell us what is likely to happen in the future. It’s easy to see the value in that. But too often predictive analytics is misunderstood. It’s seen as a silver bullet, something everyone else is already doing, something that’s relatively easy to pull off with any data for any use case — just as long as you use AI.
As always, the reality is more complicated. Predictive analytics, like all analytics, is a combination of physical phenomenon, statistics, math, and science. And predictive analytics is often used as shorthand for predictive failure analytics (PFA), a subset of predictive analytics dealing specifically with component failure.
The following article aims to present a clear-eyed assessment of both the potential benefits — and limitations — of predictive analytics as applied to solar. We’ll start with some context and useful concepts for PFA, and then apply these concepts specifically to photovoltaic generation assets (referred to generically as PV or solar). We’ll conclude with a discussion of predictive applications beyond PFA.

PREDICTIVE FAILURE ANALYTICS — SOME CONTEXT
The goal of predictive failure analytics (PFA) is to anticipate a failure before it occurs and takes down a system, resulting in an expensive forced outage. This is done primarily through condition monitoring. Wikipedia defines condition monitoring as “the process of monitoring a parameter of condition in machinery (vibration, temperature, etc.), in order to identify a significant change which is indicative of a developing fault.”1
A robust and meaningful PFA system requires four elements:
- An analytics framework capable of performing signal preparation and condition monitoring.
- A workflow management system capable of notifying users and facilitating auditing, validation, tracking, and follow up.
- A data signature that reliably identifies an impending failure with sufficient lead time to allow for mitigation.
- Operational controls and/or corrective action strategies that result in a material difference between proactive and reactive response.
If someone tells you, “We can do predictive analytics for rotating machines, therefore we can do predictive analytics for solar” — beware! The challenge with predictive analytics for solar is not in enabling analytical functionality and constructs (elements 1 and 2), but rather the identification of predictive signatures and meaningful corrective responses (elements 3 and 4).
FAILURE MECHANISMS
An understanding of PFA as applied to solar starts with a discussion of failure mechanisms — and a discussion of failure mechanisms needs to start with a discussion of nomenclature. There are many references available in the form of standards and publications which, unfortunately, can be difficult to reconcile. Therefore, it’s useful to define a few terms as they will be used in this discussion.
- Stochastic vs. Deterministic Failures
- Stochastic essentially means random. For the purposes of this discussion, stochastic will range from a failure observed for the first time to a failure that can be described by a general probability distribution. Said another way, a stochastic failure is one where it is impossible to say whether nominally identical device A or device B will be more likely to experience the failure.
- Deterministic refers to a situation in which the future state can be probabilistically determined based on the current state. In other words, where it is possible to determine the probability of failure for a specific device with higher than random confidence.
Hopefully it is obvious that effective predictive analytics rely on deterministic systems. What is perhaps less obvious is the difference between many stochastic and deterministic systems. The short answer is data.
There are very few truly stochastic processes in the engineering world. There are, however, many examples of situations where sufficient data is unavailable (or impractical to obtain) making them effectively stochastic.
Consider a relatively silly example of a fleet of nominally identical gasoline powered cars. Without gas gauges, running out of gas would appear to be a stochastic event. It would be possible to collect data to determine that the cars are most likely to run out of gas after 250 miles with a minimum of 200 miles and a maximum of 300 miles. This information would make it possible to institute planned refueling after 190 miles, effectively eliminating all “forced outages.” This is still a stochastic scenario. It is based on a general probability profile and does not allow distinction between car A and car B.
Now, if gas gauges are added to every car in the fleet, additional data becomes available. running out of gas becomes a highly reliable deterministic failure and it is possible to distinguish between the status of car A versus car B.
The other reason this example is worth the effort is because it illustrates another valuable point: the data that converts a stochastic scenario into a deterministic one is often purpose-built and is almost always supplemental rather than primary performance data. The performance of the car tells us very little about the amount of gas in the tank — and the amount of gas in the tank tells us very little about the performance of the car.
- Common Cause vs. Special Cause Failures
- Common cause failures will be used here to describe failures that cannot be corrected by changing a component or process. It will also be used to refer to failures that are inherent to the technology. Running out of gas would be a common cause failure for gas powered cars.
- Special cause failures are those that can be tied to specific components, designs, or deployments. Sticking with the automotive theme, these are the types of failures that often result in recalls. These would be failures that impact Model A but not Model B due to specific components, design, or manufacturing — and are not inherent to the definition and usage of a car.
REAL-WORLD APPLICATION: WIND TURBINE GEAR BOXES
Let’s consider a well-known application of condition monitoring — vibration monitoring of major components of rotating machines such as wind turbine gear boxes — to see how it fits with these definitions.
Gear boxes are components that experience mechanical wear and tear through normal operation. Component vibration and operating temperature are supplemental signals capable of providing predictive capability. Detectable increases in vibration or operating temperature do not prevent the component from performing its intended function but do provide a high confidence indication that the component needs corrective maintenance (to avoid accelerated aging) or that the component is approaching the end of its useful life — and catastrophic failure if not preemptively taken out of service. This is an excellent example of the attributes of PFA discussed so far.
- Stochastic vs. Deterministic:
- Based on primary performance data alone, gear box failures would appear to be stochastic. That is, at best they could be described by a probabilistic distribution of time to failure.
- With the incorporation of supplemental data — namely vibration or component temperature data — these failures become probabilistically deterministic and therefore predictable. The probability of failure of gear box A can be distinguished from that of gear box B with higher confidence than can be determined from component age alone.
- Common vs. Special:
- Mechanical wear and tear are common and impact all gear boxes. Particular designs and deployments may fair better or worse, but the overall failure mode is common — and methods of monitoring and predictive analytics can be generalized.
Now that we’ve established baseline nomenclature, the next section will discuss methods of searching for predictive data signatures.
SEARCHING FOR PREDICTIVE SIGNATURES
There are two ways to search for predictive signatures in a data system.
EXPLORATORY APPROACH
In the broadest sense, all available signals (and combinations of signals) are candidates for prediction.
At Solar Power International in 2017, GE presented an example2 of exploratory feature extraction applied to solar. For a sample site, all available data points were collected at the highest possible resolution (down to 1-second samples) and analyzed for predictive signatures.
A predictive signature was identified for an inverter liquid cooling pump. Ailing pumps were shown to exhibit statistically significant increases in AC-current draw more than 30 days prior to failure. This is an example of successful application of exploratory feature extraction applied to a special failure (as relates to the inverter). The availability of supplemental coolant pump AC-current data converts the failure from stochastic to deterministic.

TARGETED APPROACH
The second approach to predictive signature identification is to pursue a targeted approach by considering a particular component or subsystem which is prone to notably frequent or costly failures. With this approach, understanding the specific failure mode is especially important since accessing the predictive signal may require additional instrumentation, data collection, and signal preparation.
.png?width=568&height=378&name=Picture2%20(1).png)
If the liquid cooling pump failures in the previous example were identified as a particularly frequent or costly stochastic failure, but no monitoring data were available, it might be reasonable to consider collecting additional data on AC current, pump temperature, vibration, or coolant volume in search of predictive signatures.
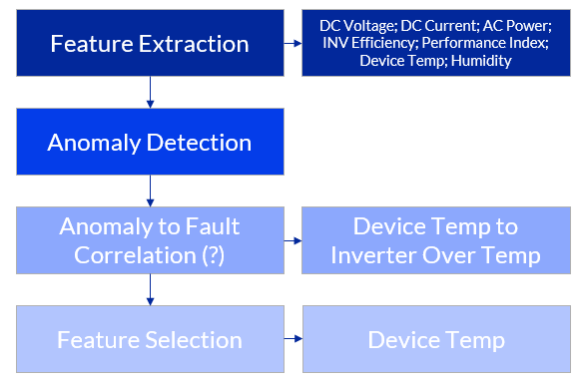
One unpublished example of this type of targeted feature extraction involved an inverter model specific failure (i.e., special) in which internal temperature sensors failed false low allowing the control system to continue driving the inverters at full load, ultimately destroying the entire inverter.
In this case, the predictive signatures were failing temperature sensors. While this example could have theoretically been discovered using an exploratory approach, it was accelerated — and simplified — by detailed understanding of the nature and root cause of the special cause failure.
Again, in this example, a stochastic failure became predictable using supplemental data — again for a special rather than a common failure mode.

OPERATIONAL CONTROLS AND CORRECTIVE ACTION STRATEGIES
Not all failure modes are created equally. Two important considerations for the application of predictive analytics are:
- The severity of the failure mode. How costly (or frequent) is it? Is the failure contained to the component? Or does it have the potential to cause significant additional damage or downtime if not prevented?
- Are there effective operational controls or preventative measures that can be taken to meaningfully control the outcome?
In addition to the presence of clear and common predictive signatures, one of the reasons why condition monitoring of wind turbine gear boxes is such a compelling example of predictive analytics is because it satisfies both criteria above. Uncontrolled gear box failure can cause extensive damage to other components and effective operational controls (namely curtailment to manage mechanical stress) exist that can reduce corrective maintenance costs by as much as 30% based on downtime mitigation and scheduling of crews, equipment, and spare parts.3
In the solar examples above, the coolant pump failure resulted in safe and controlled shutdown of the inverter and the corrective action was the same in both cases: pump replacement. In the case of the failed temperature sensor, early detection prevented catastrophic failure of the entire inverter. Furthermore, in the latter example, inverter power could be curtailed to limit loading, mitigate overheating, and allow the inverter to continue to operate safely until corrective action could be taken.
Deterministic systems (as defined here) are still probabilistic, meaning that there will always be some level of false positives and false negatives. The implication is that the mere existence of a predictive signature is not sufficient to deliver value. The cost differential between a forced outage and well-planned maintenance is a very import consideration for the application of PFA.
SOLAR PREDICTIVE FAILURE ANALYTICS: CHALLENGES AND OPPORTUNITIES
There are many reasons why solar presents such a compelling target for predictive failure analytics. For one thing, they’re relatively simple systems: photons in, electrons out, (almost) no moving parts. How hard could it be? And they produce so much data. There must be something in there!
A more serious reason is the modular and distributed nature of the systems. Lots of things go wrong and every single one of them is a logistical pain in the neck to deal with. Finally, big and expensive failures resulting in extended downtime are not uncommon. Being able to predict and prevent even a fraction of these failures would be highly valuable. The primary focus of the remainder of this section will be on PV inverters — the most complex, active, and prone-to-failure components in a PV system.
The first challenge for solar PFA is that most potentially predictable failures and causes of downtime are special rather than common cause. That is, almost all solar failures are related to specific designs, deployments, or manufacturing and cannot be generalized to cover solar installations that do not share the same characteristics.

Notable exceptions exist. For example, essentially all solar installations suffer from blown string fuses to a greater or lesser extent. This can be quite costly and result in significant underperformance if unaddressed. However, monitoring and efficient reactive corrective action are quite effective and predictive maintenance would be impractical.
Another common failure for solar could be end of useful life analysis for major inverter components, such as IGBTs. There has been significant research conducted on condition monitoring and remaining useful life (RUL) analysis for IGBTs, driven largely by other industries that rely on power converters. The most cited high potential precursor signal for IGBT aging is high frequency collector emitter voltage (Vce). But significant challenges remain for reducing this analysis to engineering practice even when this data is available.4,5
However, the fact remains that most solar failures — both great and small — are particular to the equipment, design, or deployment. This has important implications. For one thing, it is necessary to observe and distinguish special failures before considering the possibility of predicting them.
That is to say, special failure modes may often initially manifest as unanticipated and indistinguishable stochastic failures. The process of distinguishing a new special cause failure may require knowledge and information that can only be provided by field service personnel and represents another critical input outside of primary performance data. This implies the need for robust processes and information sharing to be on the lookout for new and important opportunities when and where they arise.
A second, related challenge is the fact that there is no guarantee that appropriate supplemental data capable of providing a predictive signature will be available. In general, inverter designs and internal controls are quite good and account for the relatively high reliability and low maintenance that the industry depends on.
Where failures are anticipated, and purpose-built supplemental monitoring is incorporated, it is likely that OEM faults or warnings will exist. This is an excellent starting point but represents its own challenges in mapping, interpreting, and monitoring this often esoteric information across a wide range of inverter makes and models.
In the absence of purpose-built supplemental monitoring, the search for predictive signatures becomes opportunistic. In part because there are very few common failure mechanisms for PV inverters, the depth, focus and quality of supplemental monitoring varies significantly among suppliers and models. Data availability may even vary from installation to installation of otherwise identical equipment depending on what data is mapped into SCADA or DAS systems. Just because a failure exists does not mean there will be a predictive signature in the available data.

Next, it is worth noting that predictive analytics for special failure modes, by definition, have limited applicability across different brands, models, and installations. Predictive analytics developed for a special failure mode can (and should) be scaled and applied to installations with similar equipment, monitoring, and deployment. But, by definition, they cannot be generalized to all installations.
Additionally, special failure modes typically have a root cause that can be addressed by modifications to design and deployment or by retrofit. This means that PFA for particularly frequent or costly special failure mechanisms will likely have a shelf life limited by development of more permanent corrective solutions. This is ultimately a good thing when a failure mechanism is addressed with a proper design change. In the meantime, PFA can potentially provide an inexpensive stop-gap solution while waiting for the permanent remedy.
Finally, PFA must be combined with business rules to convert the probability of failure to preventative action in a way that produces a positive net effect. For some failures capable of prediction, a business case may not exist, either because the benefit of preventative maintenance is insignificant or because the cost of preventative maintenance on False Positives outweighs the benefits of preventing True Positives. The fact that a failure is probabilistically predictable does not automatically imply that preventative corrective action will be the right thing to do.
Highlighting these challenges and limitations is not intended to imply that solar PFA is impossible or low value — especially in cases where failures are frequent, costly, or destructive. Rather, the intention is to clearly assess the space and outline important considerations that should inform the approaches taken and the expectations for success.
In summary, the search for predictive maintenance opportunities should start with leveraging OEM faults and warnings based on purpose-built, internal supplemental monitoring. For failures that exceed this capability, the search for predictive signatures should focus first and foremost on the costliest failures — with particular attention paid to those with the potential to cause extended downtime or ancillary damage.
In some cases, these may even warrant investment in additional instrumentation and data collection. In all cases, the search for predictive solutions will be significantly enhanced by a thorough understanding of the failures to be predicted. Power Factors’ suite of solutions, including field service management, assisted exploratory feature extraction, condition monitoring, and workflow management can assist in this process. And we are committed to advancing the state of the art in this important area.
OTHER TYPES OF PREDICTIONS
Of course, predictive analytics can provide other predictions for solar besides failure prediction based on condition monitoring. One example relevant to wind, solar, storage, and grid management is weather and production forecasting.
Another is probabilistic failure rate forecasting for spare parts management. Because typical solar failure and recovery is dominated by downtime reduction, appropriate spare parts management may often more impactful than prediction.
One example of probability-based predictive analytics for PV is array washing in regions subject to significant seasonal array soiling such as California’s Central Valley. Decisions about when to wash an array are often based on arbitrary factors, such as crew availability or visual inspection of arrays. (Pro Tip: the human eye can distinguish soiling on a PV module long before it has a quantifiable impact on array performance, making it a poor diagnostic tool.)
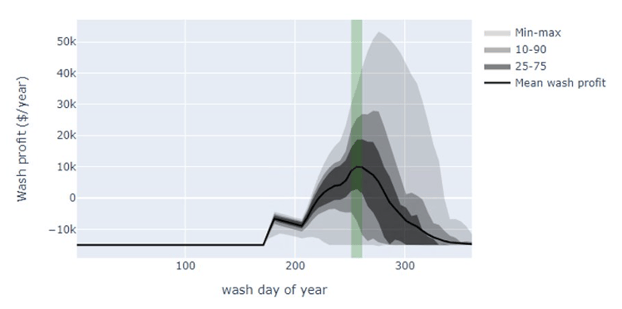
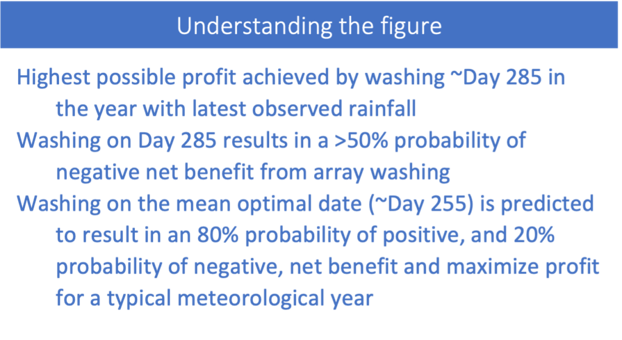
There are many variables that can be determined explicitly and influence the cost-benefit ratio of array washing, including the price of energy, the cost of washing, and the magnitude of soiling-related energy loss. However, the variable that has the greatest impact on the optimal timing of array washing is the timing of natural cleaning (that is, rainfall). For locations with seasonal soiling, this timing far exceeds the capability of numerical weather prediction and must rely instead on probabilistic climatological estimates.
The figure above demonstrates a range of probable profits (benefit minus cost) of array washing predicted for a single location in the California Central Valley. The magnitude of the profit (or loss) is determined almost exclusively by the price of energy and the cost of service — but the distribution of probable outcomes is determined by the climatological probability of when it will rain.
CONCLUSION
Opportunities to leverage predictive analytics exist for the solar sector — just not in the ways that many hope or imagine.
To recap: There are two primary limitations to the application of PFA to solar.
The first is that most predictive failure signatures for all applications are derived from secondary measurements such as component temperature, vibration, particulate analysis, or current draw — and these secondary measurements are not widely or uniformly available today.
A key element of advancing the state of the art in PFA for solar begins with better understanding of component failure frequency and impact to guide the search for meaningful predictive signatures. Opportunities exist for enhanced monitoring in areas such as tracker motor currents, in-field high frequency monitoring of parameters like collector emitter voltage, and more targeted component thermal monitoring. All these efforts will require investment and on-going research and development and Power Factors is committed to continuing to support them.

The second challenge is that many solar failure modes have the same corrective action (i.e., component replacement) whether performed proactively or reactively. Downtime mitigation has real value, but the highest potential value will come from prediction and prevention of failures that can result in ancillary damage and / or extended down time. For solar, these tend to be special rather than common cause failures.
Despite the challenges associated with PFA, the search for predictive signatures should and will continue — especially as installed capacity continues to age and major components such as IGBTs and capacitors approach end of useful life. And, finally, it’s worth remembering that the opportunities and applications for predictive analytics encompass more than just condition monitoring for predictive failure analysis including things like probable outcomes of array washing. These types of predictions will play an important role in the final article in this series covering prescriptive analytics.
Steve Voss joined Power Factors in 2016 and has over 20 years of solar industry experience. Prior to joining Power Factors, Steve spent a year working with Panasonic Energy Services and nine years with SunEdison as Director of Advanced Engineering. Steve holds an MBA from the University of Wisconsin, Madison, and a Master’s of Materials Science and Engineering from Stanford University. He did his undergraduate work at the University of Colorado, Boulder. Connect with Steve on LinkedIn.
- https://en.wikipedia.org/wiki/Condition_monitoring
- Saucier, Michael, Solar PV Uptime and Field Services Optimization – Driven by Predictive Analytics, Solar Power International 2017 Conference Proceedings, https://www.re-plus.com/wp-content/uploads/2017/08/SPI_Proceedings_2017.pdf
- MicNichol, Colin, CanWEA, 2015, Session 8 https://canwea.ca/wp-content/uploads/2015/03/Session-8-Colin-McNichol.pdf
- Fang, Xiachun et al., A Review of Data-Driven Prognostic for IGBT Remaining Useful Life, Chinese Journal of Electrical Engineering, Vol. 4, No. 3, September 2018 https://ieeexplore.ieee.org/document/8471292
- Ismail, Adla et al., A new data-drive approach for Power IGBT Remaining Useful Life estimation based on feature reduction technique and neural network, Electronics, 2020, 9, 1571 https://www.mdpi.com/2079-9292/9/10/1571
End-to-end solutions across the entire renewable asset lifecycle
![[Article 2] The First Step is the Hardest: Descriptive Analytics for PV Plants – Part I](https://www.powerfactors.com/hubfs/solar-panel-with-sunshine-9JAT3VB.jpg)
![[Article 1] The Four Types of Solar Analytics](https://www.powerfactors.com/hubfs/the-solar-energy-PXYNZS9-scaled-1.jpg)
![[Article 4] Diagnostic Analytics for PV Plants — Why Did It Happen?](https://www.powerfactors.com/hubfs/engineer-electric-woman-checking-and-maintenance-o-2022-02-01-22-37-40-utc-1.jpeg)
Optimize assets, maximize revenue, and grow your portfolio with Unity
