


[ARTICLE 3] THE FIRST STEP IS THE HARDEST: DESCRIPTIVE ANALYTICS FOR PV PLANTS – PART II
Descriptive analytics is the first step in converting data to information. This article explores examples of how of descriptive analytics can deliver tremendous value to owners and operators of PV plants.

By Steve Voss, VP of Advanced Analytics at Power Factors
This is the third article in the series What You Need to Know About Solar Analytics. In this series, Steve Voss, VP of Advanced Analytics at Power Factors, talks through what you need to know about solar analytics to get the most value out your data. Don’t miss an article: Follow Power Factors on LinkedIn.
The first article in this series introduced two constructs — the Gartner analytics ascendancy model and the “data value pyramid” — to set the stage for further discussion of PV data analytics. The second article discussed three fundamental principles required to facilitate the conversion of data to information: robust data management; auditability (showing your work!); and flexibility and functionality.
Now that we’ve laid the groundwork, this article explores examples of how descriptive analytics can deliver tremendous value to owners and operators of PV plants.
WHAT ARE DESCRIPTIVE ANALYTICS AGAIN?
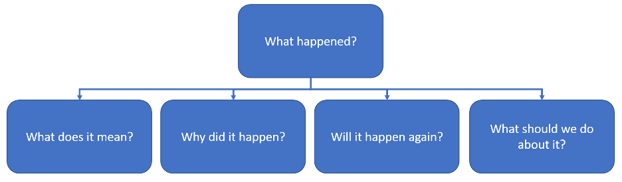
As discussed in the last article, descriptive analytics tell us what happened. They don’t give us information about why something happened or what should be done about it (these are for diagnostic and prescriptive analytics respectively).
But this doesn’t mean descriptive analytics are necessarily simple or easy to compile. When you’re dealing with devices that regularly go out of communication or calibration, even basic information such as energy produced or incident insolation can require significant effort to get right.
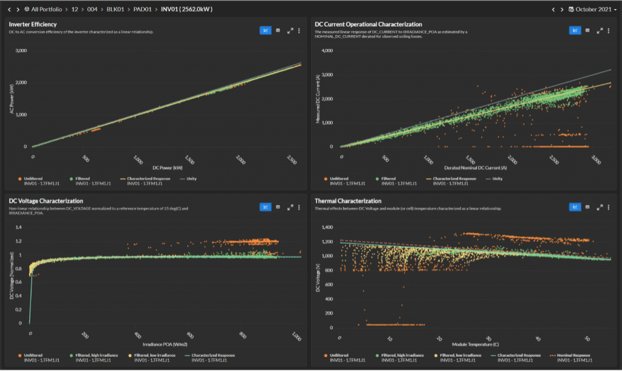
Descriptive analytics can also be the result of complicated, multi-step processes. Power Factors’ DC Characterization framework (shown below in Figure 1) is one example of this.
DC Characterization is the culmination of many rigorous steps, including data aggregation and data management; standardization of device hierarchies and metadata; validation, estimation, and editing (VEE); data capability; and event management.
The purpose of the DC Characterization framework is to isolate periods of operation where the system is unimpaired by any external conditions — such as outage, clipping, shade, snow, or curtailment — and then provide a detailed characterization of system behavior under those conditions.
At its core, DC Characterization is a set of descriptive analytical outputs based on regression analysis of independent-to-dependent-variable relationships focused on the DC performance of PV arrays. This characterization framework requires many steps, a high degree of “data capability” (see article 2 in this series for more on what we mean when we talk about data capability) and represents a sophisticated and in-depth information set.
Note that, even after all the steps and sophisticated analysis required, this set of analytical outputs is still “just” descriptive analytics. It doesn’t tell us why the results are what they are or give us any recommendation regarding what we should do about it.
But, of course, these results are incredibly useful. For example, a performance analyst could look at these findings to assess the impact of DC performance on overall site performance and, based on the findings, could use the information to point to a root cause that likely explains why DC performance is off (thermal, voltage, etc.).
Another important point to note about descriptive analytics is that they build upon each other and inform other analytical outputs. This idea is at the root of the “5 whys” concept — manifested in Kaizen, lean manufacturing, and Six Sigma — where the preceding “why” becomes the “what” for the next iteration.
- The array was offline.
- Why? The inverter shut down.
- Why? The main control board failed.
- Why? Critical solder joints failed.
- Why? Factory defect — or was it excessive heat and humidity in the inverter cabinet…?
- Why? Critical solder joints failed.
- Why? The main control board failed.
- Why? The inverter shut down.
Many actions do not require going all the way to the root cause (the fifth why) and many high-value descriptive reports can be created from the early stages of this iterative process.
For example, for the field team tasked with restoring the offline array, it is sufficient to stop at the third why: The main control board failed. For the asset manager, a descriptive analytics report detailing lost energy and the responsible party per contract may be the highest-value outcome. For a reliability engineer, a critical intermediate step might be a descriptive report indicating the frequency of a certain component failure relative to other failure modes before deciding whether to pursue further investigation.
The important point here is that no matter where in the analytical process — and no matter the level of sophistication required to reach that point — descriptive analytics represent an end point where a set of information has been established. More importantly, it represents a stepping off point from which to make further inquiries.
EXAMPLES OF DESCRIPTIVE ANALYTICS
RELIABLE COMPLIANCE REPORTING
The most common use case for descriptive analytics is reporting. Reporting can serve many purposes. First and foremost, the ability to produce a repeatable and self-consistent report demonstrates a minimum level of control of the asset and its data. Often reports will serve as documentation in support of contractual agreements — like a receipt for a credit card transaction.
These types of reports are very important — but they often are time-consuming to compile and contain limited actionable insight. Because of this, it’s valuable to minimize the human effort invested in assembling and validating compliance reports through automation.
Easier said than done, right? But this is where a performance management software system that strikes the optimal balance between flexibility and functionality comes in. (You can read more about the three foundational elements required to address the PV industry’s challenges — one of which is flexibility and functionality — in article 2).
When it comes to automating compliance reporting, a performance management system must have:
- The functionality to manage the data and get the facts in a reproducible and auditable way (showing your work!)
- The combination of functionality and flexibility to ensure calculations are done according to the requirements of the user and the data capability of the system
- The flexibility to allow users to automate the creation and delivery of custom reports that deliver necessary information and insights
All this amounts to the need for a robust and automated data management pipeline (foundational element #1) that automatically handles most use cases with (almost) no manual input.
To truly drive the success of renewable energy, today’s performance management software must automate most of the analytics in an auditable and configurable way, freeing up valuable human time for the analytics where human ingenuity is required.
Here are the five steps to get us there:
- Automate — Automate everything you can.
- Configure — Empower humans to modify the automation logic to address their use cases.
- Audit — Provide operational oversight for the automation: understand what logic was applied, when, and why, with easy human-in-the-loop feedback for automation-tuning (#2) or exception-based editing
- Empower — Provide tools that allow expert users to dive deep, validating the automation to build trust, and taking an optimal “machine/human handoff.” The software tells you everything it can about an issue and enables the humans to quickly pinpoint where to apply their expertise to fully diagnose.
- Automate (again) — The automatically-handled analytics (which should be the vast majority) combine with the optimized human-driven for comprehensive visibility and availability for automated work tracking and reporting requirements.
DECISION SUPPORT
The next use case for descriptive analytics is decision support. Properly assembled descriptive information can enable users to quickly make high-confidence decisions.
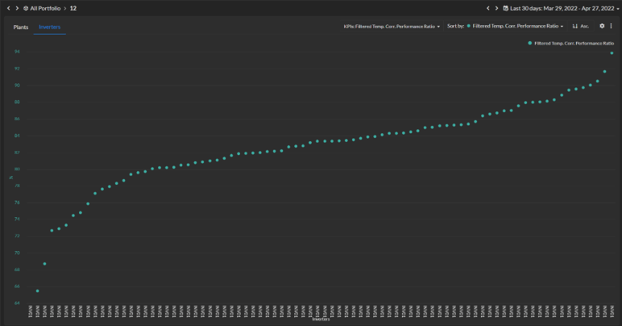
For example, Power Factors’ Peer Comparison dashboard is a simple way for users to survey a fleet of assets across a variety of key performance indicators (KPIs) and rapidly determine where to focus attention for follow-up action.
Of course, when the follow-up questions, answers, and decisions are recurring and can be reduced to practice, this represents the next obvious focal point for further development of analytical capabilities (more on this in upcoming articles).
CONTINUOUS IMPROVEMENT, BENCHMARKING, AND TREND ANALYSIS
The last application that we’ll talk about in this article is using descriptive analytics to create a consistent and common set of information across assets and through time. An isolated descriptive data point (or report) might serve an important purpose, but it often lacks context for comparison. Is the result good? Bad? Improving? Degrading?
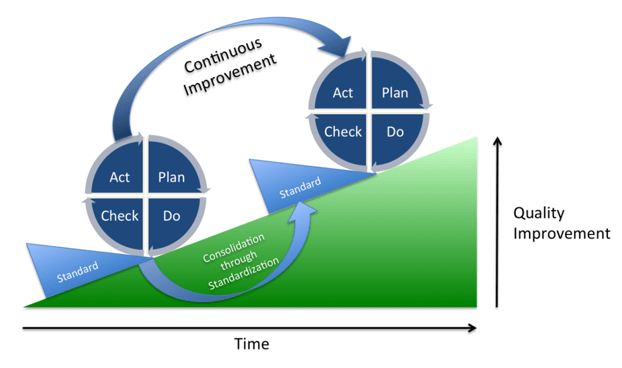
An excellent example of this is the application to a continuous improvement process (CIP). A key element of CIP is selecting the appropriate metrics to be targeted and then tracking and evaluating the impact of changes to process, parts, procedures, vendors, setpoints, etc. In this case, the why is the variable being tested and the descriptive result is the answer as to whether a targeted result was achieved.
Another high-value application of consistent KPIs (i.e., descriptive analysis) gathered across a variety of assets through time is benchmarking. High-quality benchmarking — done right and done meaningfully — is a big job. In the case of CIP, the user is essentially conducting a controlled experiment.
Benchmarking, on the other hand, represents the ultimate uncontrolled experiment. It is essentially taking the results and conditions available for study and seeing what insights can be gleaned. Effective benchmarking requires three things:
- Sufficient observations for each of the test groups (e.g., OEMs, service providers or installation conditions),
- Sufficient diversity of samples to ensure that samples are not confounded by competing effects (e.g., service provider performance confounded by equipment type), and
- Consistent data and analytical treatment across the board.
For #1 and #2, this generally means massive amounts of data! For #3, especially in the case where data must be anonymized to be consolidated, it means ensuring that methods and results can be audited and validated — without needing to return to the data source.
One common approach to benchmarking is like CIP in the sense that it attempts to isolate a single metric (e.g., mean time to failure (MTTF)) and compare it across a defined set of test cases (e.g., inverter models). This, of course, has its value.
The downside of this approach, however, is the limited scope. This approach to benchmarking is purpose-built and capable of answering only a single question at a time. An alternative approach is to assemble a large-scale, multi-dimensional benchmarking data set and then allow the user to select the dimensions on which to sort, filter, and group KPIs.
Power Factors’ products currently service over 125GW of generating capacity across wind, solar, storage, and hydro; on five continents; and include performance, field service, and asset management data sets. A significant initiative for us in 2022 is to collaborate with our customers to explore the most impactful ways this data set can be leveraged to ask unique questions and uncover new insights.
CONCLUSION
Descriptive analytics are often dismissed as the lowest-value form of analytics. However, they often derive from sophisticated analysis. As the essential conversion of data to information, descriptive analytics serve as the necessary foundation — the stepping-off point — for future iterations of higher order analysis (as will be discussed in the remainder of this series).
Often time-consuming and repetitive, descriptive analytics present us with an opportunity for better efficiency through quality improvement and automation. But most importantly, never underestimate the value of high-quality, accessible descriptive analytical information for fostering creativity, opening new lines of inquiry, and revealing hidden insights.
Steve Voss joined Power Factors in 2016 and has over 20 years of solar industry experience. Prior to joining Power Factors, Steve spent a year working with Panasonic Energy Services and nine years with SunEdison as Director of Advanced Engineering. Steve holds an MBA from the University of Wisconsin, Madison, and a Master’s of Materials Science and Engineering from Stanford University. He did his undergraduate work at the University of Colorado, Boulder. Connect with Steve on LinkedIn.
End-to-end solutions across the entire renewable asset lifecycle
![[Article 2] The First Step is the Hardest: Descriptive Analytics for PV Plants – Part I](https://www.powerfactors.com/hubfs/solar-panel-with-sunshine-9JAT3VB.jpg)
![[Article 4] Diagnostic Analytics for PV Plants — Why Did It Happen?](https://www.powerfactors.com/hubfs/engineer-electric-woman-checking-and-maintenance-o-2022-02-01-22-37-40-utc-1.jpeg)
![[Article 5] Predictive Failure Analytics — What Will (Probably) Happen](https://www.powerfactors.com/hubfs/aerial-top-view-of-a-solar-panels-power-plant-2021-08-28-11-59-44-utc.jpeg)
Optimize assets, maximize revenue, and grow your portfolio with Unity
