[ARTICLE 4] DIAGNOSTIC ANALYTICS FOR PV PLANTS — WHY DID IT HAPPEN?
As the solar industry continues to grow, one important area for continuous improvement and maturation is in the area of diagnostic analytics.

By Steve Voss, VP of Advanced Analytics at Power Factors
This is the fourth article in the series What You Need to Know About Solar Analytics. In this series, Steve Voss, VP of Advanced Analytics at Power Factors, talks through what you need to know about solar analytics to get the most value out your data. Don’t miss an article: Follow Power Factors on LinkedIn.
In this series, we’ve been working our way through the Gartner analytics ascendency model and its application to photovoltaics (PV) operations, maintenance, and asset management.
We discussed descriptive analytics in the second and third articles in this series. Descriptive analytics is the first step — the practice of determining what happened. Typically, descriptive analytics manifests in the PV industry as reporting: an account of what happened in the past day, week, month, etc.
This article will discuss diagnostic analytics: what they mean, why they’re important, the tremendous opportunities that still exist, and some of the associated challenges.
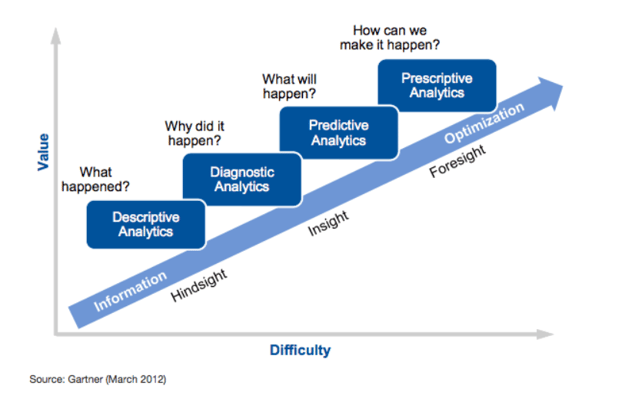
One tricky thing about diagnostic analytics is their recursive nature with descriptive analytics, as discussed here. It may take multiple “whys” to establish root cause. However, establishing a true root cause is not always necessary for decision-making (see article 3 for examples). For the purposes of this article, diagnostic analytics is defined as the practice of determining why did it happen — or, the transition from understanding an issue to evaluating the appropriate response.
WHY DIAGNOSTIC ANALYTICS MATTER
Diagnostic analytics are critical for improving operational efficiency in the PV industry. Rapid detection and notification of the condition (i.e., descriptive analytics — what happened) is an important starting point, but, if the automated analysis stops there, the process still requires a person to diagnose the issue and determine the appropriate corrective action.
Depending on the situation, this can be expensive and time-consuming. Consider a simple example of an inverter that is operating normally right up to the moment where it goes out of communication. There are many possible explanations for why this happened.
.jpeg?width=622&height=415&name=maintenance-engineer-solar-energy-systems-enginee-2022-03-21-12-40-14-utc-1024x683%20(1).jpeg)
For example:
- Communications fault — inverter is still operating
- Inverter shut down, failed automatic restart — manual or remote reset required
- Inverter overheated — cooling system maintenance required
- Controller board failure — spare parts and qualified technician required
The action required to restore the inverter to normal operation is different in each case. Therefore, minimizing the time, effort, and expense required to determine the appropriate action is critical to increasing PV operational efficiency.
This helps ensure the right technician — with the right tools, parts, and expertise — is sent the first time.
DIAGNOSTIC METHODS
Diagnostic analysis is all about finding and interpreting additional context. If the descriptive analysis determines “this device is down” or “this device is underperforming,” diagnosis requires additional context to move beyond this basic assessment.
Diagnostic analysis is therefore a two-part problem:
- Obtaining the additional information
- Interpreting that additional information
Obtaining additional information is largely a brute-force exercise. Additional context can come from many sources, such as:
- Additional time series data (weather, nearby devices, 3rd party reference data)
- Metadata (location, device manufacturer, mounting type, etc.)
- OEM fault codes
Interpreting this additional information requires more finesse and intelligence and is still a largely manual process in the PV industry — often requiring zooming in, zooming out, and looking at the data from multiple perspectives. For an analyst, this process is often the fastest and easiest path to diagnosis, thanks to the human brain’s ability to utilize available data, fill gaps, filter anomalies, recognize patterns, remember the past, and dynamically weigh different factors.
But ultimately the goal is to enable a machine to replicate — or even improve upon — the ability of an expert analyst to perform this process and reach a proper diagnosis. The next sections will discuss some of the challenges associated with autonomous diagnostic analysis and Power Factors’ approach to solving them.

CHALLENGES FOR AUTONOMOUS DIAGNOSTIC ANALYSIS
PV systems are relatively simple systems: there are only so many things that can go wrong with them. This makes it relatively easy to build a system that solves for a narrow subset of scenarios — and is the reason why it is so tempting to underestimate the difficulty of building DIY / in-house asset performance management solutions.
The challenges of scalable PV diagnostic characterization don’t come from the complexity of the systems themselves — they come from their diversity: diversity of equipment, diversity of deployments, and diversity of data capability (meaning both data quality and availability).
So, while it may be relatively straightforward to build a system to solve for a constrained set of scenarios, scalable autonomous diagnostic analysis requires a system with the ability to provide meaningful insight across a wide variety of conditions. This requires a robust and scalable analytical framework.
- Robust — The system needs to be able to provide reliable, repeatable, meaningful information and insights across all dimensions of this variability:
- Applicable to all scenarios
- Able to take advantage of rich data sets when available to provide the deepest / most meaningful insights possible
- Scalable — Counterbalancing the need to provide meaningful insights is the need to be able to do so with a relatively low bar of required inputs:
- An algorithm that requires 25 inputs will be less widely applicable than one that requires 5
- So, it’s important to minimize the critical inputs — and then to try to ensure that those critical inputs are as universally available as possible — to provide valuable insights
- Every scenario that is excluded – due to any dimension (i.e., OEM, design, location, conditions, or data capability) limits the scalability of the solution
The ideal solution provides meaningful insights with a minimum of inputs across a wide range of scenarios. It then utilizes supplemental information, when available, to enhance the confidence, precision, resolution, and speed of the diagnosis.
BUILDING A ROBUST AND SCALABLE DIAGNOSTIC SYSTEM
Power Factors’ approach to building a robust and scalable diagnostic analytics system is built on two foundational elements.
The first is our Data Capability module (discussed in the second article of this series). Data Capability is how explicit starting assumptions are articulated, tested, and communicated to both users and to the system.
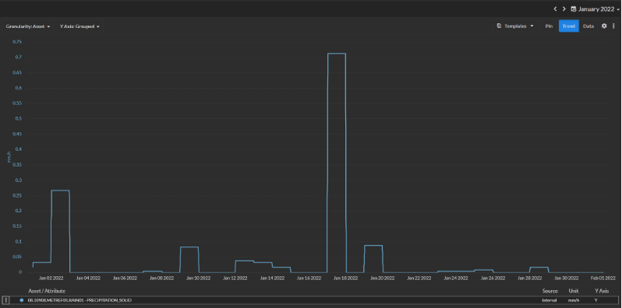
The second foundational element is the identification, classification, and quantification of all explicitly “knowable” events and impairments, including outages, curtailments, shading, and clipping (including sub-interval clipping), as shown in Figure 2 below. Filtering for these explicitly knowable events allows for the calculation of a Filtered Temperature Corrected Performance Ratio (FTCPR).
This gives us the ability to isolate periods of normal or unimpaired performance, dramatically increasing the signal to noise ratio and making performance assessment faster and easier.
.png?width=622&height=374&name=Picture2%20(2).png)
Focusing on this filtered data set facilitates a number of interesting analytical approaches, including detailed characterization of DC performance data and long-term performance characterization.
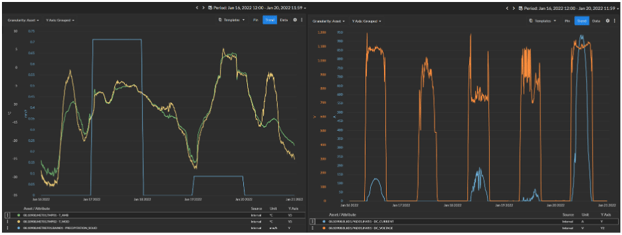
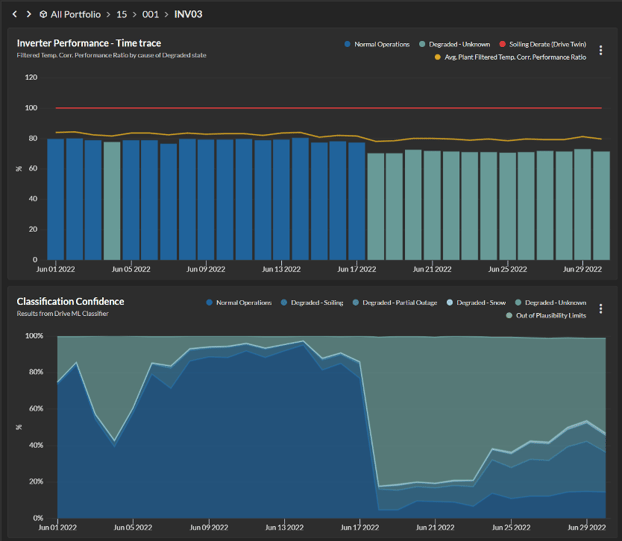
But the most relevant application here is for diagnostic analysis. One powerful approach utilizes a supervised machine learning algorithm to recognize indicative diagnostic patterns in the data, as illustrated in Figure 3. Utilizing the filtered data sets significantly increases the ability to identify and diagnose other issues such as snow, soiling, DC outages (i.e., blown string fuses), and tracker failures.
.png?width=622&height=262&name=Picture3%20(1).png)
And, to ensure scalability, Power Factors designed for a relatively low common denominator — with the ability to consume additional information when and where available. For example, our approach does not require tracker angle data, DC side data, or DC combiner data in order to diagnose issues.
A key objective here is to provide a high degree of capability based on modest data inputs while also facilitating the use of supplemental data to improve the confidence, speed, or resolution of the diagnosis. The below example illustrates these concepts.
EXAMPLE: ESTABLISHING UNDERPERFORMANCE DUE TO SNOW
An experienced PV analyst could look at the data represented in Figure 3, add the context that this inverter is in New York state, and conclude with a very high degree of confidence that this underperformance is due to snow.
For an algorithm, we need to be more explicit. The simplest way to do this is to tell the algorithm when it snows and that, if the underperformance coincides with snowfall, the underperformance is likely due to snow. Unfortunately, most PV sites do not provide data on snowfall.
To ensure a robust baseline of diagnostic analysis, Power Factors incorporates independent weather data (including precipitation data) for all monitored locations. This enables our second layer of diagnostic analysis to classify outages and underperformance due to snow with a similar degree of confidence to the experienced PV analyst — all with a relatively low set of baseline requirements that we ensure are met for all systems.
However, weather data is imperfect: other things can and do go wrong when it snows, and we don’t have reliable information about how long snow is likely to persist on the modules.
This is an area where additional information could be considered based on a couple of simple observations about the interaction between PV and snow:
- When modules are covered with snow, module temperatures match ambient temperatures
- Modules covered with snow generate enough potential to activate an on-line inverter — there will be DC voltage, even if there is little or no DC current
With the incorporation of this supplemental information, the confidence of the diagnosis now significantly exceeds the initial “January in New York” diagnosis. However, measured module temperatures and DC current and voltage data are far from universally available for all sites, cannot be inferred for this application, and therefore cannot be included in the baseline diagnosis without compromising scalability.
Therefore, to keep it robust and scalable, our software works with FTCPR and precipitation data alone. But it’s flexible enough to give the option of incorporating supplemental data to provide deeper insights and higher-confidence assessments.
This ability to consider previously established facts (i.e., data capability and explicitly knowable events), incorporate available data, and look at an issue from multiple perspectives is where machine-based diagnostic analytics begins to rival the capability of an expert analyst.
Similarly elaborate narratives are possible for other common PV issues, including tracker stalls, DC string fuse failures, and soiling. In all cases, the goal is to be able to start from the broadest (most scalable) capable baseline possible and then supplement where possible.
For example, Power Factors’ Degraded Classification module identifies issues with offline combiners or strings based on FTCPR trends alone. When supplemented with DC combiner data, the diagnosis can be both accelerated and more capable.
The case study below shows just how much of an impact this can make.
REAL-WORLD APPLICATION: DC STRING FUSES CASE STUDY
In July of 2020, the site manager of a cluster of four co-located plants in California was given access to Power Factors’ Degraded Classification module shortly after its release to production. Understandably, the site manager was skeptical of the ability of remote diagnostic analytics to perform as well as in-person DC inspections but agreed to trial the module.
Consisting of 82 nearly identical arrays and inverters, the four sites included combiner box DC current data in addition to FTCPR trends, enabling higher-resolution data and faster and more targeted diagnosis.
Early in the trial, the site manager dispatched a technician to a combiner box diagnosed as having six strings offline — believing he’d debunk our analysis and be done. But when the technician verified the diagnosis and found six blown string fuses, we were off to the races.
One key element of the four sites in this case study is the fact that each site had its own interconnection agreement and PPA rate, with 16 of the 82 inverters receiving a significantly higher $/MWh PPA rate. These 16 inverters were the obvious priority for maximizing yield.
The fall of 2020 was spent washing modules and replacing string fuses, but the first half of 2021 provides an excellent before-and-after comparison to the first half of 2020.
Using improved automated diagnostic characterization and human prescriptive application, the site achieved a 0.9% improvement in yield from the “low-revenue” portion of the plant and an impressive 3.7% improvement for the “high-revenue” portion — with no change in personnel or O&M expense.
Same site, same equipment, same personnel — but now utilizing Power Factors’ diagnostic analytics.
Changes in the performance of the high-revenue inverters ranged from +2.2% to 6.5%. Changes on the low-revenue inverters ranged from -2.4% to +5.2%, clearly indicating that there are further gains to be had.
Figure 7 and Table 1 below illustrate the impact of this initiative:
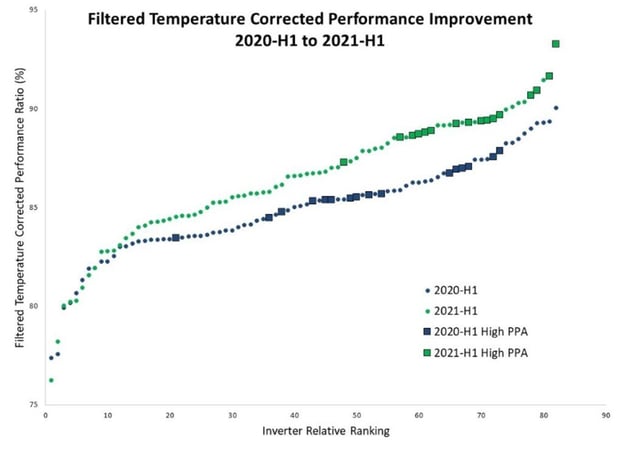
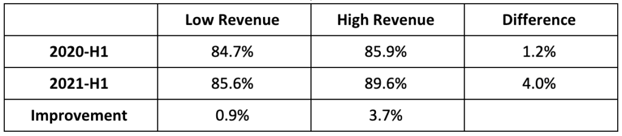
In the example above, differences in energy yield for the best- and worst-performing inverters was approximately 18%. For context, that is equivalent to a nearly 33-day complete inverter outage over the same period. So, while it will always be wise to prioritize detection and response to actual inverter outages, failing to address underperformance leaves large amounts of renewable energy undelivered — and money on the table.
CLOSING THOUGHTS
As the solar industry continues to grow, one important area for continuous improvement and maturation is in the area of diagnostic analytics. As system costs have declined, more and more relative importance shifts to system performance and operational efficiency to ensure profitability. This requires automation that can match the capability of human analysts — executed continuously.
Scalability requires starting with a robust foundation of capable analytics with minimal requirements while high functionality requires the flexibility to incorporate and utilize additional information where available.
The approach Power Factors has pursued to achieve this is the compartmentalization of information into discrete facts. This has several advantages, including the ability to audit the availability and veracity of individual pieces of information, the ability to build robust baseline diagnostic capabilities, and the ability to effectively supplement this baseline with additional information as it is available.
Finally, diagnostic analytics represents a key turning point at which issue management transitions from understanding an issue to evaluating the appropriate response (action). This is the transition to prescriptive analytics — which is where real value is created.
The next article in this series will discuss the application of predictive analytics to PV. The sixth and final article will focus on prescriptive analytics.
Steve Voss joined Power Factors in 2016 and has over 20 years of solar industry experience. Prior to joining Power Factors, Steve spent a year working with Panasonic Energy Services and nine years with SunEdison as Director of Advanced Engineering. Steve holds an MBA from the University of Wisconsin, Madison, and a Master’s of Materials Science and Engineering from Stanford University. He did his undergraduate work at the University of Colorado, Boulder. Connect with Steve on LinkedIn.
End-to-end solutions across the entire renewable asset lifecycle
![[Article 2] The First Step is the Hardest: Descriptive Analytics for PV Plants – Part I](https://www.powerfactors.com/hubfs/solar-panel-with-sunshine-9JAT3VB.jpg)
![[Article 3] The First Step is the Hardest: Descriptive Analytics for PV Plants – Part II](https://www.powerfactors.com/hubfs/aerial-top-view-of-a-solar-panels-power-plant-LG9ZG4C.jpg)
![[Article 5] Predictive Failure Analytics — What Will (Probably) Happen](https://www.powerfactors.com/hubfs/aerial-top-view-of-a-solar-panels-power-plant-2021-08-28-11-59-44-utc.jpeg)
Optimize assets, maximize revenue, and grow your portfolio with Unity
