How to Identify Soiling Losses Caused by Wildfires
Solar operators can boost the performance of projects affected by wildfires by 1–3% by using asset performance management software to identify and address losses caused by wildfire ash, says Power Factors’ Technical Director Stephen Lightfoote.
How to Identify Soiling Losses Caused by Wildfires
By Stephen Lightfoote, Technical Director at Power Factors
California’s 2020 wildfire season was the worst on record for the US state, with an estimated 4.2 million acres burned. Figures from 2020 report five of the six largest wildfires in California’s history happened between October and November 2020.
And the warming climate is predicted to worsen the hot, dry conditions that contribute to the regularity and severity of wildfires. This constitutes a growing risk for California, other states in the US, and countries around the world, with a series of potentially devastating impacts from loss of life to damage to property.
For the operators of solar photovoltaic (PV) arrays, wildfires can have two serious effects on the energy performance of projects. First, they make the atmospheric conditions smokier or hazier; and second, they deposit particulates on the solar PV panels (i.e., soiling). Both reduce the amount of sunlight reaching the panels and negatively impact the energy performance of solar projects and their profits.
It is this second impact that Power Factors has sought to better understand. Our research shows that ash from wildfires can reduce the performance of solar PV projects in nearby areas by 1–3% annually. This is in addition to the losses caused by the smokier and hazier atmospheric conditions.
In our research we focused specifically on soiling from wildfires in California, but, of course, the impact of soiling goes far beyond both. Soiling caused by snow, salt, and bird droppings also causes solar asset underperformance.
For this research, we studied the performance of 150 solar PV arrays in California between 2018 and 2020 using our in-depth project performance and machine learning data. The data highlighted trends that can help owners and operators make important decisions about where and when to clean solar PV panels to optimize performance.
Because they can be mitigated by cleaning, soiling losses (other than snow) are considered controllable — but it is up to the owner or operator to decide if cleaning the panels makes financial sense. To make this decision, they need accurate estimates of energy loss due to soiling.
This is where the degraded performance methodology from Power Factors comes in.
What is Degraded Performance?
We can understand degraded performance by looking at two theoretical inverters with the same expected performance (see graphic 1, below): Inverters A and B.
The area under the black outline shows nominal power: the power that could be produced by each inverter after expected operational losses and clipping losses. The blue region shows each inverter’s actual performance. We can see, then, that Inverter A is performing to close its full potential (aside from some losses due to an outage and shading) because the blue area nearly fills the space contained within the black outline.
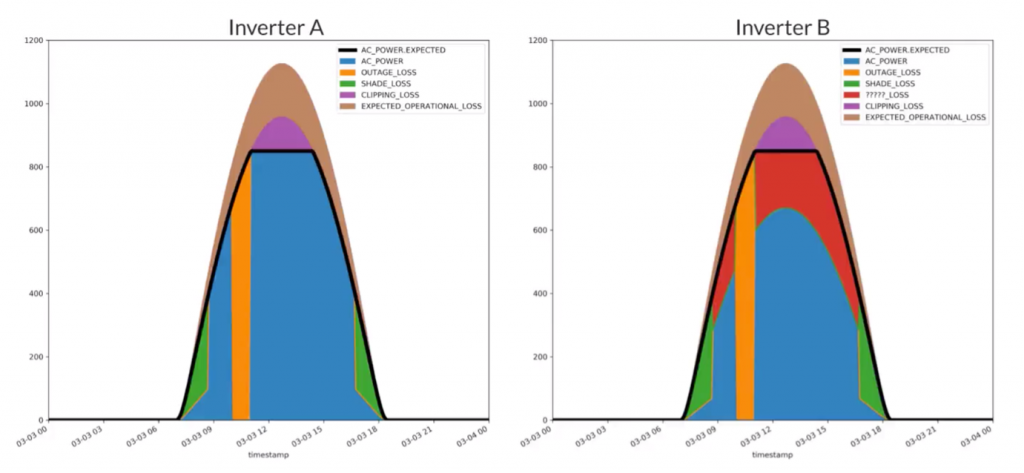
By contrast, Inverter B is underperforming: the blue area (AC power) is significantly smaller than for Inverter A. Inverter B not only shows losses from shading and outage, it also shows significant losses — indicated in red — that are due to unknown cause(s).
So, while Inverter A shows expected performance, Inverter B shows degraded performance, indicating to the owner or operator that they need to investigate the reason(s) for that degraded performance or continue to suffer significant losses.
One possible reason for underperformance is soiling, and we can use the project performance data mentioned above to tell us whether this is the case for Inverter B. We can do this by using our “degraded performance characterization methodology,” because different reasons for underperformance show up differently in the project performance data.
How Does the Degraded Performance Characterization Methodology Work?
This methodology is based on what we call the daily filtered temperature-corrected performance ratio, a variant of the standard temperature-corrected performance ratio filtered for unconstrained and event-free intervals. By removing these, we can focus our analysis on the performance losses caused by inefficiency at the inverter or array level.
In Power Factors’ Drive Pro platform, we use a machine learning method that classifies each inverter’s daily performance in one of seven ways:
- Normal operations: This shows an inverter operating normally.
- Implausible: This shows an inverter where performance is implausible likely due to data quality issues.,
- Incomplete: This could be something like an inverter being in an outage state or out of communication for the whole day.
- Degraded – Snow: DC array is impacted by snow
- Degraded – Soiling: DC array is impacted by soiling
- Degraded – Partial Outage: Some aspect(s) of the DC array (tracker, combiner boxes, strings) are in an outage state
- Degraded – Unknown: Inverter Performance is impacted but the root cause is unknown
This provides labels and associated probabilities that quantify lost energy and give reasons for it, enabling solar operators to take informed action.
Tracking the performance data also allows us to go into greater depth to find out the probable reason for the underperformance (see graphic 2, below). The graphs below show how four types of degradation affect inverter performance differently, providing visual “signatures” of each type of degradation within the performance data.
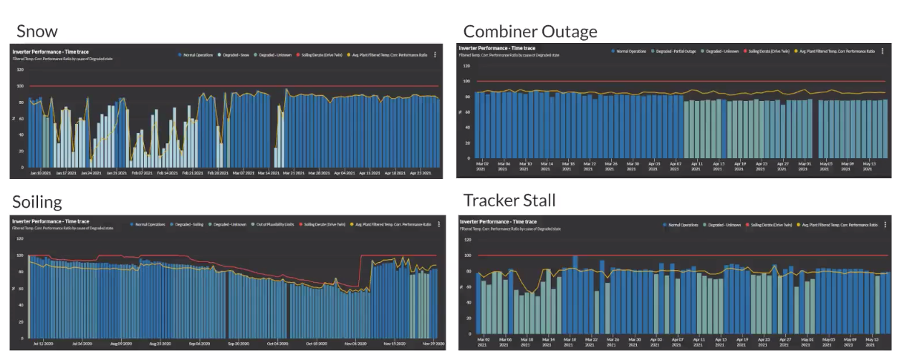
For example, when inverters are affected by snow (top left) then we would expect to see them underperforming on days when the snow falls and immediately afterwards, but otherwise begin performing normally again when the snow melts.
Inverters that are affected by combiner outages (top right) will see step changes in performance; and those with trackers that repeatedly stall and are fixed (bottom right) have a different profile too.
We also can see in the performance data that soiling (bottom left) has a unique impact on performance. Performance of the inverters declines gradually as dirt, dust, or ash builds up on solar panels, causing the inverters to perform worse as time goes on — that is, until the panels are cleaned and performance immediately recovers.
As the above examples demonstrate, sophisticated data modeling and machine learning detect inverters impacted by soiling — including soiling from wildfire ash — faster. This gives asset managers the information they need to decide if and when cleaning is economically warranted. The performance data also helps companies quantify losses caused by soiling and predict how soiling will affect performance over time.
How Does This Apply to Wildfires?
As discussed in the beginning of this article, wildfires have two main impacts on solar projects. First, as Clean Power Research recently reported, they cause atmospheric smoke and/or haze, significantly reducing the amount of sun that hits the solar panels. Second, they deposit ash on solar panels. This second impact is the focus of Power Factors’ analysis.
For our research, we looked at soiling rates at 150 projects on a month-by-month basis over three years from 2018 to 2020. Typically, soiling rates stay relatively stable from year to year. However, soiling rates were significantly worse in 2020 during the months when wildfires were at their worst (see graph, below). This shows a clear correlation between wildfires, soiling, and solar underperformance.
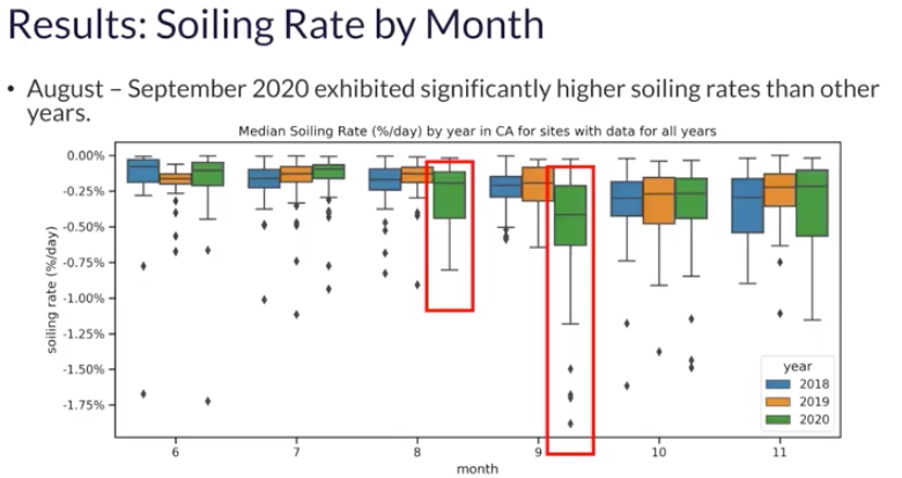
We also saw that projects were more impacted by soiling in counties that were affected most by wildfires, such as Kern County.
This is important because, while the 2020 wildfire season was an outlier, wildfires are not a one-off event. As climate change increases the risk and severity of wildfires — in California and elsewhere — we can expect to see significant impacts on available resource (sunlight) and performance of solar PV projects in coming years.
How Should Operators and Asset Managers Respond?
The first step for operators and asset managers is recognizing that soiling from wildfires has a significant impact on solar project performance and financial returns.
The next step is employing asset performance management software, like Power Factors’ Drive, to help identify and quantify wildfire soiling (and other soiling) losses faster and more accurately.
Drive, for example, even separates losses attributable to smoke cover from those caused by soiling from ash build-up. Decoupling these issues from each other enables better decision-making around how best to address and mitigate these losses. Power Factors is planning to introduce new features that help solar asset managers to further optimize module washing times to maximize revenues in 2022.
The reason for this is straightforward. Smoke cover and soiling caused by wildfires will become an increasingly important issue for solar operators globally in the coming years.
We are still analyzing data from the 2021 California wildfire season, but the wildfires we have seen in Western Australia in recent months (and, more recently, in Colorado) remind us that this issue is not specific to California — or to the US.
Scientific research tells us that wildfires will only get more extreme as temperatures rise around the world. These can only have a detrimental impact on the growing level of installed solar capacity around the world, which is now over 700GW globally.
If you own solar farms, whether in California or elsewhere, access to the right data — and the ability to quantify the financial impact of wildfires on your assets — is an important first step.
Did you find this article helpful? Sign up for our newsletter for the latest in extreme weather impacts, performance optimization and more!
This article is based on a presentation called “Are California Wildfires Exacerbating PV Array Soiling Issues” at the American Clean Power Association’s Cleanpower 2021 Virtual Summit last June. We hope to see you at this year’s Cleanpower 2022 in Texas!
Stephen Lightfoote has over 10 years of extensive experience in a broad range of development and operational aspects of wind and solar projects, concentrating largely on data-driven approaches to asset performance characterization and optimization. At Power Factors, Mr. Lightfoote develops and implements advanced tools for PV assets focusing on diagnostic, predictive, and prescriptive analytics. He is also a major contributor to Power Factors’ Single Model Characterization (SMC) framework which was funded through the U.S. Department of Energy’s PVRD2 initiative. Connect with Stephen on LinkedIn.